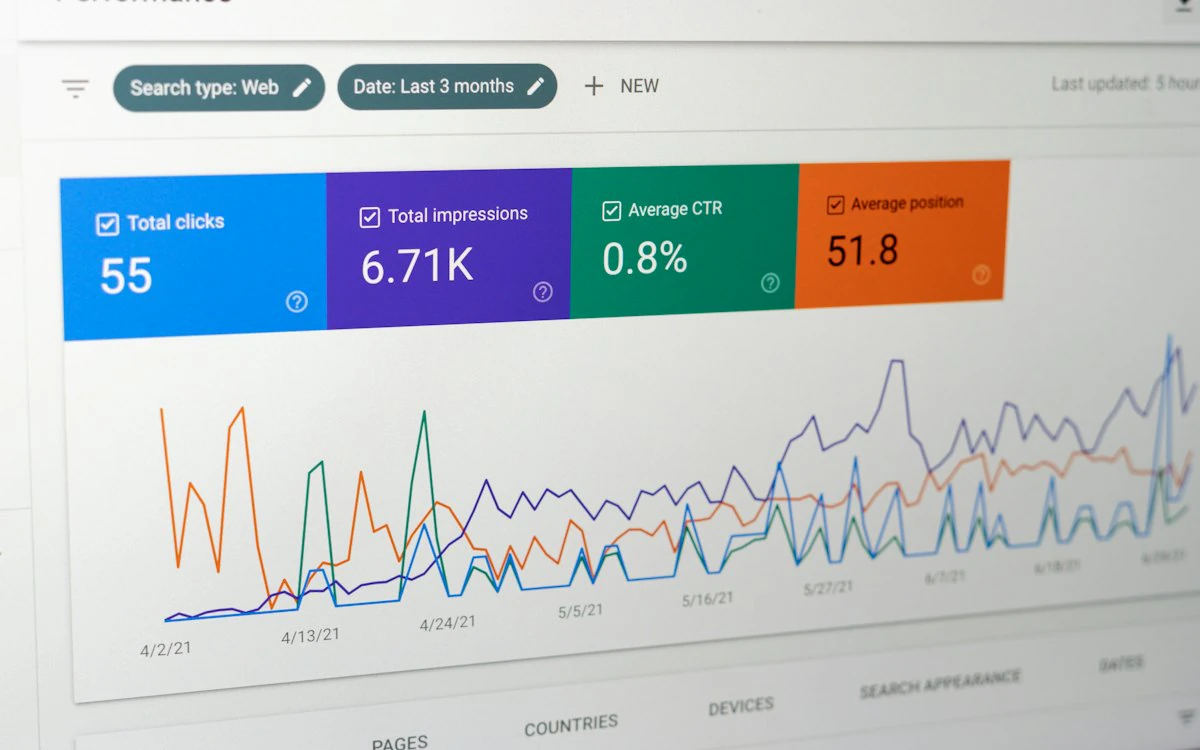
Marketing teams have no shortage of numbers.
You can measure:
- Website traffic
- Leads
- Conversion rates
- Ad spend
- Cost per acquisition
- ROAS
- Organic traffic
- Search rankings
- Email engagement
- Pipeline
- Revenue
But there is a problem.
More metrics don't necessarily create more clarity.
A CEO may not want to open five dashboards and study dozens of charts to understand whether marketing is performing well.
A CMO may know that some campaigns are improving while others are declining, but still struggle to communicate the overall picture to leadership.
Marketing needs a simpler way to answer one important question:
How healthy is our marketing performance right now?
That's where a Marketing Health Score can help.
A Marketing Health Score combines multiple dimensions of marketing performance into a single, easy-to-understand indicator.
Instead of looking at isolated metrics, it provides a high-level view of whether marketing is moving in the right direction.
What Is a Marketing Health Score?
A Marketing Health Score is a composite measurement that summarizes the overall health and effectiveness of a company's marketing performance across multiple important areas.
Rather than relying on one metric, it considers several dimensions such as:
- Paid marketing efficiency
- Organic marketing momentum
- Email and outbound performance
- Lead and pipeline contribution
- Budget efficiency
- Conversion performance
- Overall marketing trends
The score can then be represented on a simple scale, such as:
0–100
For example:
90–100
- General interpretation
- Excellent
75–89
- General interpretation
- Healthy
60–74
- General interpretation
- Needs attention
40–59
- General interpretation
- At risk
0–39
- General interpretation
- Critical
| Score | General interpretation |
|---|---|
| 90–100 | Excellent |
| 75–89 | Healthy |
| 60–74 | Needs attention |
| 40–59 | At risk |
| 0–39 | Critical |
These ranges are illustrative rather than universal.
The important point is consistency.
A business should define its own scoring model based on its goals, business model, marketing channels, and historical performance.
Why Do Businesses Need a Marketing Health Score?
Marketing performance is multidimensional.
A company can have excellent website traffic but poor lead quality.
It can have strong advertising ROAS but weak pipeline contribution.
It can generate a large number of leads while customer acquisition costs are increasing.
Looking at individual metrics can therefore create misleading conclusions.
Consider this example:
- Website traffic: ↑ 30%
- Leads: ↑ 15%
- Paid CAC: ↑ 25%
- Qualified leads: ↓ 5%
- Pipeline: ↑ 3%
Is marketing healthy?
It's difficult to answer from one metric.
A Marketing Health Score forces the organization to look at performance more holistically.
The CEO's Ten-Second Problem
Executives often need a quick answer.
Imagine a CEO asking:
"How is marketing doing?"
The traditional answer might be a 20-slide presentation.
The CMO may explain:
- Paid advertising performance
- Organic growth
- Website traffic
- Email engagement
- Lead generation
- Pipeline
- Campaign performance
- Budget utilization
But the CEO's actual question is much simpler:
"Should I be confident in marketing performance?"
A Marketing Health Score doesn't replace detailed reporting.
It gives executives a starting point.
For example:
Marketing Health Score: 78/100
Then leadership can investigate the drivers behind that score.
A Marketing Health Score Should Not Be Just One KPI
A common mistake is to confuse a health score with a single marketing KPI.
For example:
ROAS = 4.2x
is not a Marketing Health Score.
Neither is:
Lead growth = 18%
Neither is:
Website traffic = +25%
These are individual indicators.
A health score combines multiple signals.
The purpose is to provide a broader view of marketing performance.
The Five Core Areas of a Marketing Health Score
A practical Marketing Health Score can be built around five major dimensions.
1. Paid Marketing Efficiency
Paid marketing can consume a significant portion of the marketing budget.
Useful inputs may include:
- ROAS
- CPA
- CAC
- Conversion rate
- Spend efficiency
- Campaign performance
- Budget utilization
For example, if spend is increasing while qualified conversions are declining, the paid marketing component of the score should reflect that deterioration.
2. Organic Marketing Momentum
Organic marketing is often measured using traffic and rankings.
But a stronger model considers momentum.
Useful inputs can include:
- Organic sessions
- Search visibility
- Keyword performance
- Organic conversions
- Engagement
- Landing-page performance
- Organic pipeline contribution
For example:
Organic traffic ↑ 20% Organic leads ↑ 18% Organic pipeline ↑ 23%
That indicates healthier organic momentum than traffic growth alone.
3. Email and Outbound Health
Email and outbound channels can provide important signals about audience engagement and demand generation.
Potential inputs include:
- Open rates
- Click-through rates
- Replies
- Conversion rates
- Qualified responses
- Meeting generation
- Campaign performance
The precise metrics should depend on the business model.
4. Lead and Pipeline Contribution
Marketing shouldn't be evaluated only on activity.
It should be connected to business outcomes.
Useful metrics include:
- Leads generated
- Marketing-qualified leads
- Sales-qualified leads
- Opportunities
- Pipeline generated
- Revenue influenced or attributed
- Lead-to-opportunity conversion
This is particularly important for B2B companies.
A campaign producing 1,000 low-quality leads may be less valuable than one producing 100 highly qualified opportunities.
5. Budget Discipline
Marketing performance also depends on how efficiently resources are used.
Useful measures include:
- Budget vs actual spend
- Cost per acquisition
- Cost per qualified lead
- Channel efficiency
- Spend allocation
- Forecast vs actual
A marketing organization that consistently exceeds its budget without corresponding business outcomes should not receive the same health score as one maintaining strong performance within budget.
How to Calculate a Marketing Health Score
There is no single universal formula.
The right model depends on:
- Business model
- Marketing maturity
- Sales cycle
- Channel mix
- Growth stage
- Revenue model
However, a simple weighted model can work well.
For example:
Paid marketing efficiency
- Weight
- 25%
Organic momentum
- Weight
- 20%
Email & outbound
- Weight
- 15%
Lead & pipeline contribution
- Weight
- 25%
Budget discipline
- Weight
- 15%
Total
- Weight
- 100%
| Dimension | Weight |
|---|---|
| Paid marketing efficiency | 25% |
| Organic momentum | 20% |
| Email & outbound | 15% |
| Lead & pipeline contribution | 25% |
| Budget discipline | 15% |
| Total | 100% |
Each area receives a score between 0 and 100.
The final score can then be calculated as:
Marketing Health Score =
(Paid × 25%) + (Organic × 20%) + (Email/Outbound × 15%) + (Pipeline × 25%) + (Budget × 15%)
Worked Example: How a Company Gets a Score of 78
Consider a hypothetical B2B SaaS company.
Its marketing performance is:
Paid marketing
- Score
- 82
- Weight
- 25%
- Weighted score
- 20.5
Organic marketing
- Score
- 76
- Weight
- 20%
- Weighted score
- 15.2
Email & outbound
- Score
- 72
- Weight
- 15%
- Weighted score
- 10.8
Pipeline contribution
- Score
- 81
- Weight
- 25%
- Weighted score
- 20.25
Budget discipline
- Score
- 75
- Weight
- 15%
- Weighted score
- 11.25
Total
- Score
- Weight
- 100%
- Weighted score
- 78.0
| Area | Score | Weight | Weighted score |
|---|---|---|---|
| Paid marketing | 82 | 25% | 20.5 |
| Organic marketing | 76 | 20% | 15.2 |
| Email & outbound | 72 | 15% | 10.8 |
| Pipeline contribution | 81 | 25% | 20.25 |
| Budget discipline | 75 | 15% | 11.25 |
| Total | 100% | 78.0 |
The final Marketing Health Score is:
78/100
At first glance, that looks healthy.
But the individual scores provide additional context.
Paid and pipeline performance are relatively strong.
Email and outbound performance are weaker.
Budget discipline is acceptable but not excellent.
This is why the overall score should never be presented without the factors behind it.
What Does a Marketing Health Score of 78 Mean?
A score of 78 could indicate:
Marketing is performing healthily overall, but there are specific areas that deserve attention.
Leadership can then investigate:
- Why is outbound performing below other channels?
- Is budget being allocated efficiently?
- Which campaigns are driving pipeline?
- Are weaker areas improving or deteriorating?
The score becomes a starting point for investigation rather than the final answer.
Your Score Should Be Relative to Your Business
One of the biggest mistakes businesses can make is copying someone else's scoring model.
A 75 might be excellent for one company and poor for another.
For example, an early-stage startup might prioritize:
- Lead growth
- Website conversion
- Paid acquisition
- Pipeline creation
An established enterprise might place more weight on:
- Pipeline velocity
- CAC
- Revenue contribution
- Customer acquisition efficiency
- Multi-channel attribution
An ecommerce company may emphasize:
- ROAS
- Conversion rate
- Average order value
- Customer acquisition cost
- Repeat purchases
The framework should adapt.
How to Weight a Marketing Health Score for SaaS
For B2B SaaS, consider giving greater weight to:
- Pipeline
- Qualified leads
- CAC
- Paid efficiency
- Organic demand generation
A possible model:
Pipeline contribution
- Weight
- 30%
Paid efficiency
- Weight
- 25%
Organic performance
- Weight
- 20%
Lead quality
- Weight
- 15%
Budget discipline
- Weight
- 10%
| Dimension | Weight |
|---|---|
| Pipeline contribution | 30% |
| Paid efficiency | 25% |
| Organic performance | 20% |
| Lead quality | 15% |
| Budget discipline | 10% |
The exact weights should depend on your go-to-market strategy.
How to Weight It for Ecommerce
Ecommerce companies may focus more heavily on direct revenue and acquisition efficiency.
Possible inputs:
- ROAS
- CAC
- Conversion rate
- Revenue
- Average order value
- Repeat purchases
A possible model:
Revenue performance
- Weight
- 30%
Paid efficiency
- Weight
- 25%
Conversion rate
- Weight
- 20%
Organic performance
- Weight
- 15%
Budget discipline
- Weight
- 10%
| Dimension | Weight |
|---|---|
| Revenue performance | 30% |
| Paid efficiency | 25% |
| Conversion rate | 20% |
| Organic performance | 15% |
| Budget discipline | 10% |
Again, the model should be customized rather than treated as a universal standard.
How to Weight It for Marketing Agencies
Agencies managing multiple clients may need to evaluate:
- Client campaign performance
- Budget utilization
- Lead generation
- Client ROI
- Account growth
- Reporting consistency
The score can also be calculated separately for each client.
That makes it easier to answer:
"Which client accounts are healthy?"
and:
"Which accounts need attention?"
What a Marketing Health Score Can Tell You
A health score is particularly useful for identifying overall direction.
For example:
Last month: 71 This month: 78
That suggests improvement.
But a single score isn't enough.
You should also examine:
Paid: 82 → 88 Organic: 70 → 74 Pipeline: 76 → 81
Now you can see what drove the improvement.
Track the Score Over Time
A Marketing Health Score becomes more useful when tracked consistently.
For example:
January
- Score
- 68
February
- Score
- 71
March
- Score
- 73
April
- Score
- 69
May
- Score
- 75
June
- Score
- 78
| Month | Score |
|---|---|
| January | 68 |
| February | 71 |
| March | 73 |
| April | 69 |
| May | 75 |
| June | 78 |
This creates a performance trend.
You can then ask:
Why did the score decline in April?
Or:
What changed between April and June?
The score becomes a useful signal for performance movement.
A Health Score Should Show the Drivers
Avoid presenting:
Marketing Health Score: 78
and nothing else.
Instead, show:
Marketing Health Score: 78
- Paid efficiency: 82
- Organic momentum: 76
- Email & outbound: 72
- Pipeline contribution: 81
- Budget discipline: 75
This provides context.
Even better, highlight the most important changes.
Improving
Pipeline contribution ↑ 12%
Needs attention
Outbound conversion ↓ 9%
Opportunity
Paid Campaign X generating qualified leads below average CPA
Now the score becomes actionable.
What a Marketing Health Score Cannot Tell You
A health score is useful, but it has limitations.
It cannot completely explain:
- Why customers behave differently
- Whether attribution is perfect
- Whether a campaign will continue performing
- External market changes
- Competitor activity
- Brand perception
- Future demand
- Every reason behind a performance change
It is also possible for a business to have a healthy overall score while a critical issue is developing inside one channel.
That's why the score should be treated as a high-level signal, not a complete marketing diagnosis.
Avoid the Single-Number Trap
The simplicity of a health score is both its strength and its weakness.
A CEO may love seeing:
78/100
But a marketer needs to know:
Why 78?
And:
What needs to change to reach 85?
Therefore, a strong Marketing Health Score should have at least three layers:
Layer 1: Overall score
78/100
Layer 2: Category scores
Paid, organic, email, pipeline, budget.
Layer 3: Insights
The specific changes, problems, and opportunities influencing those scores.
This creates the progression:
Score → Context → Action
How AI Makes Marketing Health Scores More Useful
Calculating the score manually can become difficult.
Marketing teams need to:
- Collect data
- Update spreadsheets
- Normalize metrics
- Apply formulas
- Compare periods
- Identify changes
- Interpret results
AI-powered marketing intelligence can automate much of this process.
Instead of manually checking every channel, an AI system can continuously analyze connected data and identify meaningful changes.
For example:
Marketing Health Score: 78
Overall performance improved 6 points this month. Pipeline contribution and paid efficiency were the largest positive contributors. Outbound conversion declined and is the primary area requiring attention.
That is much more useful than a static number.
How QuikInsight Uses Marketing Health Score
QuikInsight includes a Marketing Health Score designed to provide a high-level view of marketing performance.
Instead of requiring leaders to interpret dozens of charts first, the score provides an immediate signal about the overall state of marketing.
It can then be used alongside QuikInsight's broader intelligence capabilities to understand:
- What is happening
- What is working
- What is not working
- Why performance is changing
- What deserves attention next
This is particularly useful for executives who need a quick view and marketing teams that need the detail behind it.
The objective isn't simply to create another KPI.
It's to create a shared performance language between marketing teams, CMOs, CEOs, and other stakeholders.
Marketing Health Score vs Traditional Marketing KPIs
Website traffic
- What it tells you
- How many visitors you receive
Leads
- What it tells you
- How many leads marketing generates
CPA
- What it tells you
- How much acquisition costs
ROAS
- What it tells you
- Advertising return
Pipeline
- What it tells you
- Potential revenue generated
Revenue
- What it tells you
- Business outcome
Marketing Health Score
- What it tells you
- Overall marketing performance across multiple dimensions
| Metric | What it tells you |
|---|---|
| Website traffic | How many visitors you receive |
| Leads | How many leads marketing generates |
| CPA | How much acquisition costs |
| ROAS | Advertising return |
| Pipeline | Potential revenue generated |
| Revenue | Business outcome |
| Marketing Health Score | Overall marketing performance across multiple dimensions |
A health score doesn't replace these metrics.
It sits above them.
Think of it as an executive-level signal that points you toward the areas that deserve deeper analysis.
How to Build a Marketing Health Score Yourself
If you want to build one without dedicated software, follow these steps.
Step 1: Define your business outcomes
Decide what marketing is ultimately responsible for.
Examples:
- Revenue
- Pipeline
- Qualified leads
- Customer acquisition
- Growth
Step 2: Select the most important dimensions
Avoid including every metric available.
Choose the dimensions that genuinely reflect marketing health.
Step 3: Assign weights
Make sure the total equals 100%.
Your weights should reflect your business model.
Step 4: Establish benchmarks
Compare performance against:
- Previous period
- Target
- Historical average
- Forecast
- Industry benchmark where appropriate
Step 5: Calculate category scores
Normalize each category to a consistent scale.
For example:
0–100
Step 6: Calculate the overall score
Apply the weights.
Step 7: Add context
Document the biggest changes behind the score.
Step 8: Review consistently
A health score is most useful when measured regularly.
Weekly or monthly measurement can work depending on your marketing cycle.
The Best Marketing Health Score Is Actionable
The real test isn't whether your score looks impressive.
The test is whether it changes decisions.
Suppose your score is:
64
That's useful if it leads to:
"Paid efficiency has deteriorated significantly. We need to review campaign allocation."
Or:
86
That's useful if it leads to:
"Performance is strong. We should identify which channels are driving the improvement and determine where additional investment makes sense."
The score should create a bridge between measurement and action.
Frequently Asked Questions
What is a Marketing Health Score?
A Marketing Health Score is a composite measurement that summarizes multiple areas of marketing performance into a single score, usually on a 0–100 scale.
How do you calculate a Marketing Health Score?
You can calculate it by assigning scores and weights to important dimensions such as paid marketing, organic performance, email, pipeline contribution, and budget efficiency, then combining the weighted scores.
What is a good Marketing Health Score?
There is no universal "good" score. A business should define its own benchmarks based on its goals, historical performance, business model, and marketing maturity.
Should a Marketing Health Score be 0–100?
A 0–100 scale is useful because it is intuitive and easy to communicate, but businesses can use other scales if they prefer.
Is a Marketing Health Score the same as a marketing KPI?
No. A KPI measures a specific aspect of performance. A health score combines multiple KPIs and dimensions into a broader performance signal.
How often should you calculate a Marketing Health Score?
The appropriate frequency depends on the business. Weekly monitoring can work for businesses with high-volume marketing activity, while monthly measurement may be more appropriate for businesses with longer sales cycles.
Can AI calculate a Marketing Health Score?
Yes. An AI-powered marketing intelligence platform can connect marketing data, analyze performance, apply a defined scoring framework, and continuously update the score.
What should a Marketing Health Score include?
Common areas include paid marketing efficiency, organic momentum, email and outbound health, lead and pipeline contribution, and budget discipline. The exact inputs should depend on the business.
Final Takeaway
Marketing performance is too complex to be represented by a single metric.
But it can also be too complex for executives to understand through dozens of disconnected dashboards.
A Marketing Health Score creates a middle ground.
It provides:
One score for visibility.
Multiple dimensions for context.
AI-powered insights for understanding.
Actions for improvement.
The ultimate goal isn't to make marketing performance look simpler than it really is.
It's to make the important signals easier to see.
With the right framework, a Marketing Health Score can become a shared language between marketing teams and business leadership—and help organizations move from simply reporting marketing activity to continuously improving marketing performance.
See it running on your business.
A walkthrough built around how your team works today.